In This article
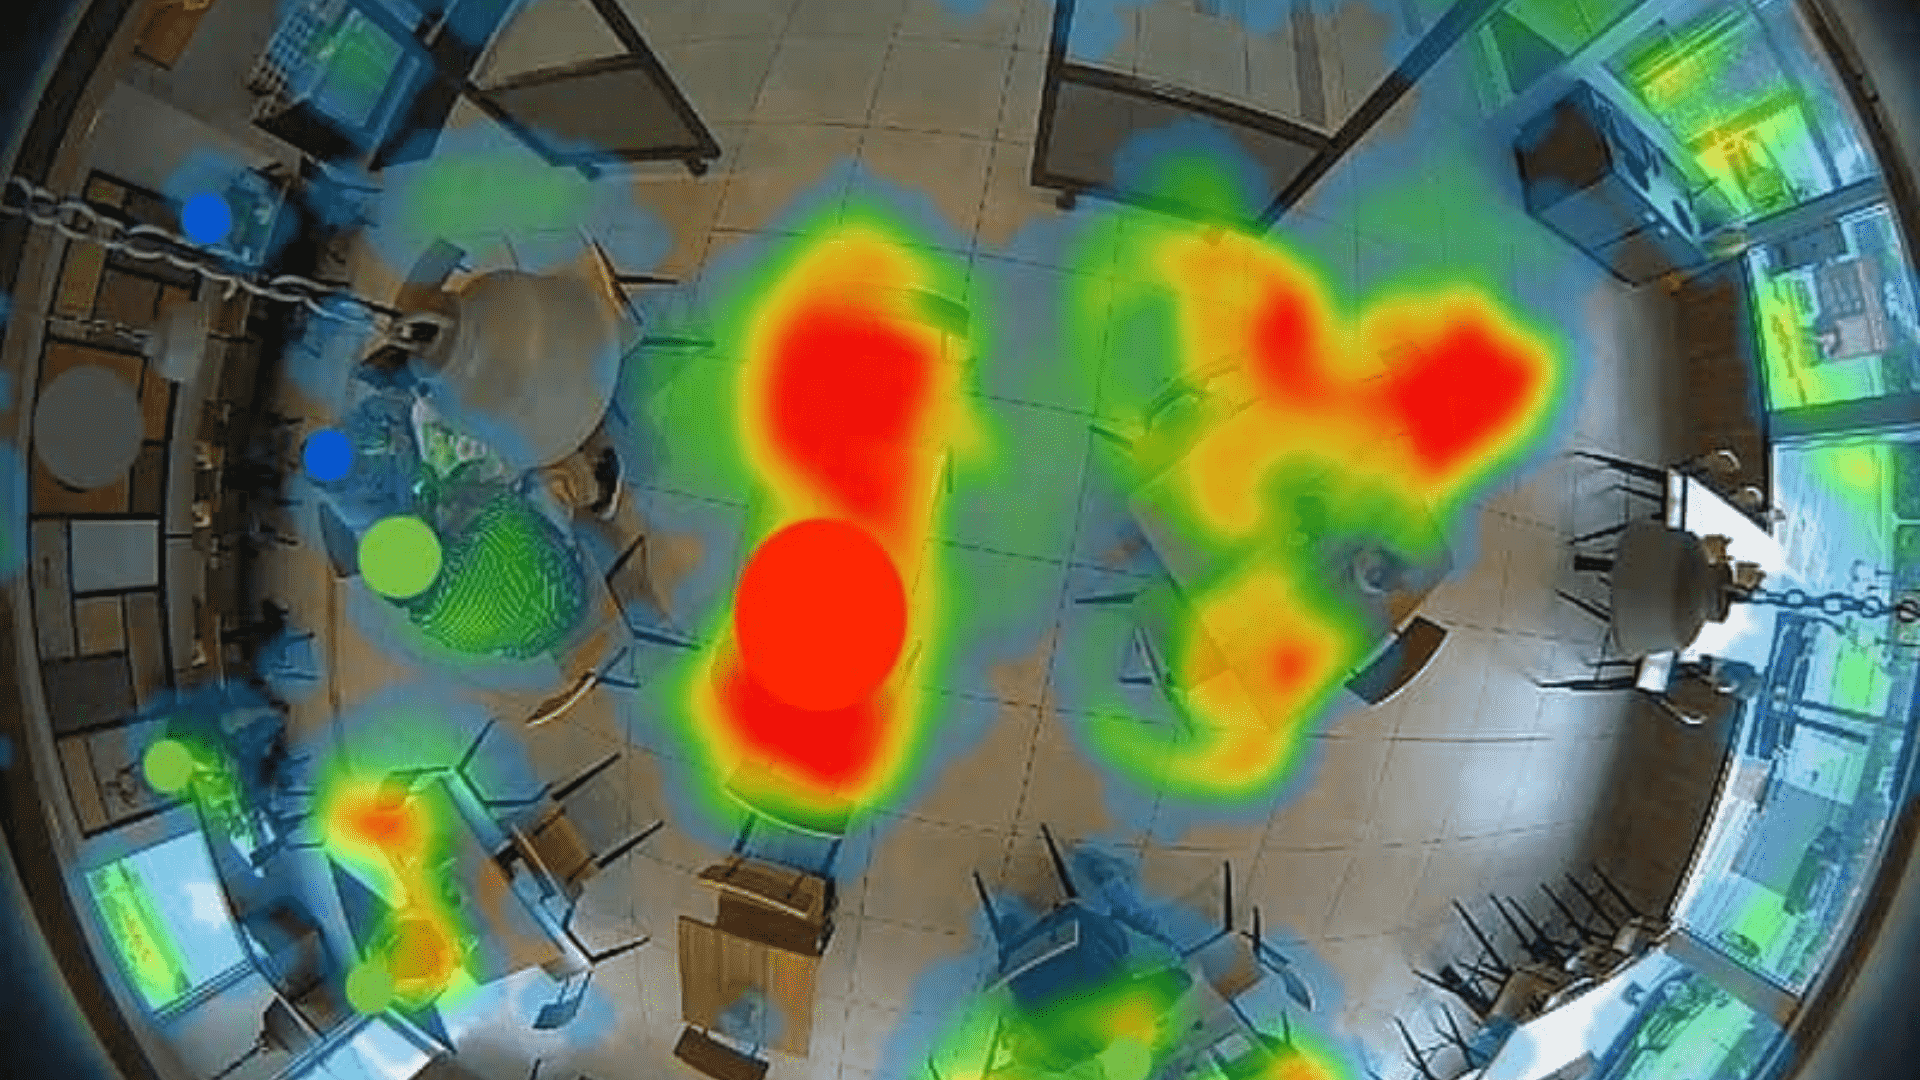
Heat mapping captures data to visualize foot traffic in facilities, helping businesses understand how people move and interact within their environments. Using surveillance systems or sensor-based tracking, businesses can collect spatial data and display it as a heat map, where warmer colors indicate higher activity and cooler colors represent lower engagement.
Heat mapping is typically used to evaluate customer flow, identify popular areas, and spot underutilized zones in retail, hospitality, and commercial spaces. This information is key in improving store layouts, adjusting product placement, optimizing staffing, and enhancing the overall customer experience.
Heat Mapping in Retail
Heat maps are often generated through video analytics systems that detect and track individuals over time. These systems compile movement data and overlay it on a floor plan, using red, yellow, green, and blue colors to illustrate traffic density and dwell time. The result is a clear, at-a-glance view of how people navigate the space.
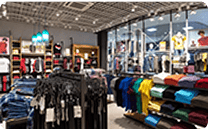
For example, a heat map of a retail store might reveal that customers spend most of their time near the entrance and promotional displays, while bypassing areas in the back. This insight could lead to relocating high-margin products to places with better visibility or creating new pathways to encourage deeper exploration of the space.
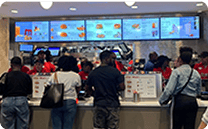
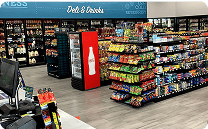
Heat mapping is not limited to retail. It can highlight areas with bottlenecks near pickup counters or food prep stations in restaurants. Logistics can show whether employees follow optimized warehouse routes or spend excessive time in inefficient zones. Heat maps can help assess how guests engage with amenities or navigate shared spaces in hospitality or event venues.
Benefits of Heat Mapping
The value of heat mapping lies in its ability to convert raw movement data into intuitive, visual insight. Without needing to observe or review hours of footage manually, business leaders can immediately spot patterns and make informed decisions.
Key benefits of heat mapping include:
- Improved layout and design decisions, based on how customers naturally move through a space.
- More effective product placement and merchandising, targeting areas with the highest visibility.
- Better staffing allocation, aligning personnel with high-traffic zones or peak activity periods.
- Enhanced operational efficiency by reducing congestion or rerouting workflows.
- Support for safety and compliance, particularly in monitoring crowd density or restricted access areas.
Heat maps can be generated in real time or compiled over days, weeks, or months for long-term trend analysis. Combined with other data sources—sales performance, customer demographics, or staffing schedules—they provide even deeper insight into what drives engagement and conversion.
Businesses using heat mapping as part of a broader analytics strategy gain a more complete understanding of customer behavior and space effectiveness. By identifying what draws attention and what gets ignored, they can adjust with purpose rather than assumption.
Heat Mapping and DTiQ
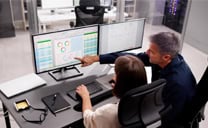
DTiQ heat mapping solutions help businesses analyze foot traffic and engagement in real time. By combining video analytics with intelligent dashboards, DTiQ heat mapping provides a clear view of where customers go, where they pause, and what influences their behavior. These insights help you make smarter layout, staffing, and merchandising decisions across every location you manage. For more information on all DTiQ solutions, visit our website.
